
Introduction: The Power of Infographics in Storytelling and Marketing
Imagine being able to condense complex information into a visually appealing, easy-to-understand format that not only engages your audience but also boosts your brand’s visibility. Now, stop imagining and start creating with infographics! As a professional in a leadership role, you’re responsible for marketing and brand promotion, and infographics are a powerful tool you can leverage. They are a creative and strategic approach to encapsulate massive amounts of data or information into a compact, visually engaging graphic.
In the realm of content marketing, infographics reign supreme due to their ability to tell compelling stories. They can transform dry data into an engaging narrative, making it easier for your target audience to digest and retain information. As a result, infographics can dramatically enhance your brand’s storytelling and marketing efforts.
This guide, ‘The Ultimate Guide to Creating Effective Infographics,’ is your comprehensive resource for understanding the process of creating infographics that not only inform but also engage and inspire. Whether you’re part of a nonprofit, association, or a small business, infographics can elevate your brand and connect with your audience in a meaningful way.
But why are infographics so effective? They are visually appealing and easily shareable on social media platforms, making them a valuable tool in your content marketing arsenal. Also, they are versatile and can be used across various platforms, from blogs and emails to presentations and reports.
In the following sections, we will dive deeper into the key elements of successful infographics, the steps to create them, and how to promote them for maximum exposure. So, if you’re ready to elevate your brand through effective storytelling and marketing, let’s delve into the world of infographics!
Understanding the Key Elements of a Successful Infographic
A well-crafted infographic is more than just a pretty picture. It’s a visual representation of data, information, or knowledge that tells a compelling story. Understanding the key elements of a successful infographic is essential to create a design that not only looks good but also delivers the message effectively.
The Role of Storyboarding in Infographic Design
Storyboarding is the foundation of your infographic. It’s a visual outline that helps you organize your ideas and information in a logical flow. It allows you to map out the main points and the structure of your infographic, ensuring that your audience can easily follow and understand your story.
The Importance of Design and Style in Infographics
Design and style play a pivotal role in infographic creation. This includes elements such as layout, use of graphics/images, fonts, and optimization for sharing. The design should be engaging and aesthetically pleasing, using a color palette and style consistent with your brand’s identity. Remember, the right colors can evoke emotions, capture attention, and enhance your brand recognition.
In terms of typography, choosing the right font style, size, and spacing can significantly impact the readability and overall aesthetic of your infographic. Consistency in typography is vital for brand recognition, so select a set of fonts that reflect your brand’s personality and stick to them.
The Visual Appeal of Infographics
Visual appeal is what draws the viewer’s eye to your infographic. Balance, achieved through the clever use of color, scale, and position, creates a sense of stability in your designs. Contrast, created through variations in color, size, shape, and texture, can be used to create visual interest and highlight important elements in your design.
Space, often referred to as negative or white space, adds a certain aesthetic quality to your design and highlights the most important elements. It’s also crucial to understand the common reading patterns like the “F,” “E,” and “Z” to help you place important elements strategically.
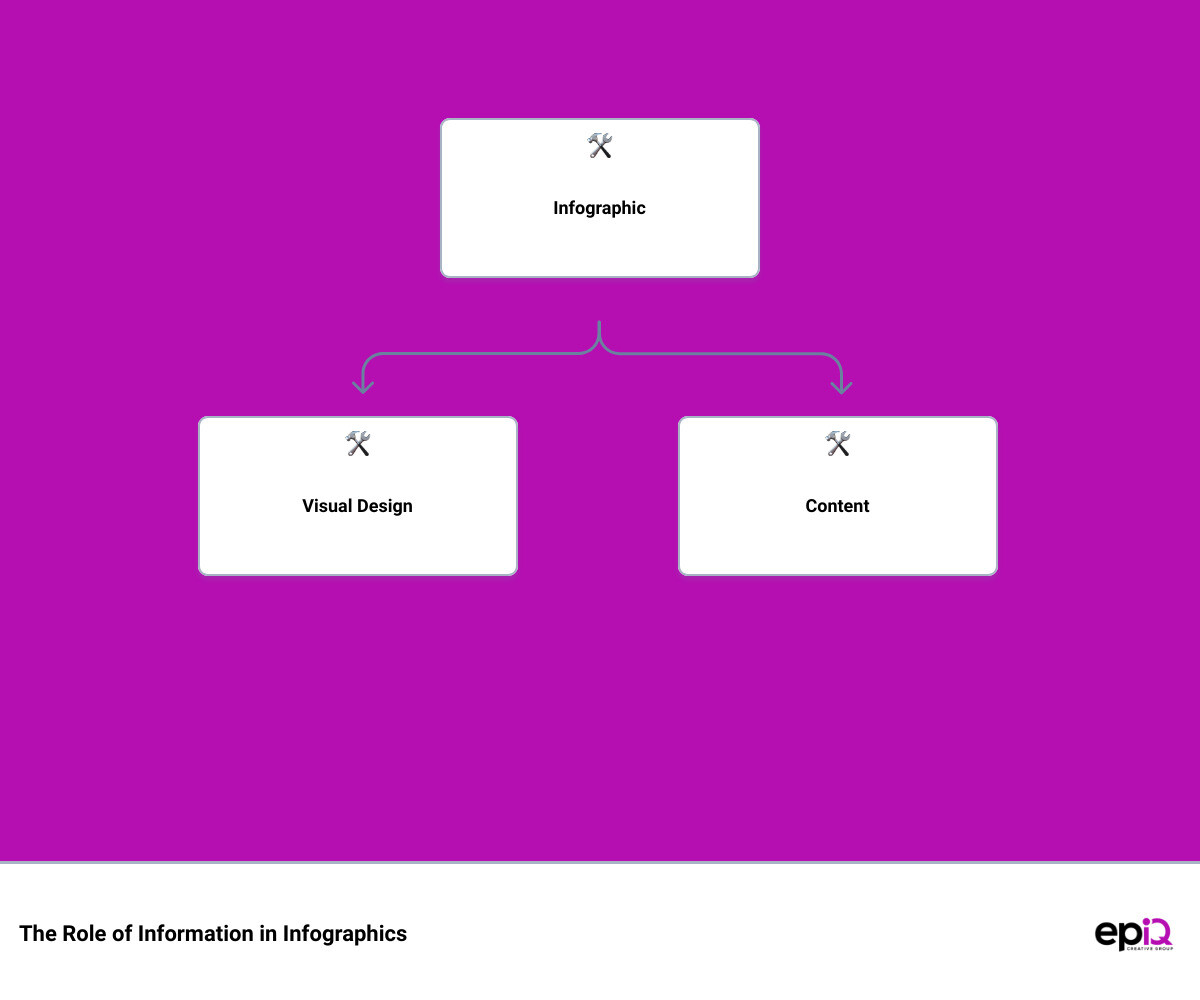
The Role of Information and Content in Infographics
The information or content you present in your infographic is what delivers value to your audience. It’s crucial to ensure that your data is accurate, relevant, and presented in a clear and concise manner. The information should flow logically, guiding your audience through your story or message seamlessly.
The Impact of Size and Shape on Infographics
The size and shape of your infographic should be considered carefully. Too large, and it may be difficult for viewers to digest the information. Too small, and important details may be missed. The shape of your infographic can also influence how information is perceived. For instance, circular shapes can be used to represent cycles or processes, while linear shapes are often used to depict timelines or sequences.
Understanding these key elements will put you on the path to creating effective infographics that not only look great but also resonate with your audience and effectively convey your message.
The Seven Steps to Creating an Effective Infographic
Just like a compelling story, a successful infographic follows a well-crafted blueprint. Follow these seven steps to ensure your infographic hits the mark.
Defining Your Audience
The first step in creating an effective infographic is understanding who will be consuming it. What are their interests and needs? What kind of data are they interested in? The answers to these questions will help you tailor your infographic to meet the needs of your audience.
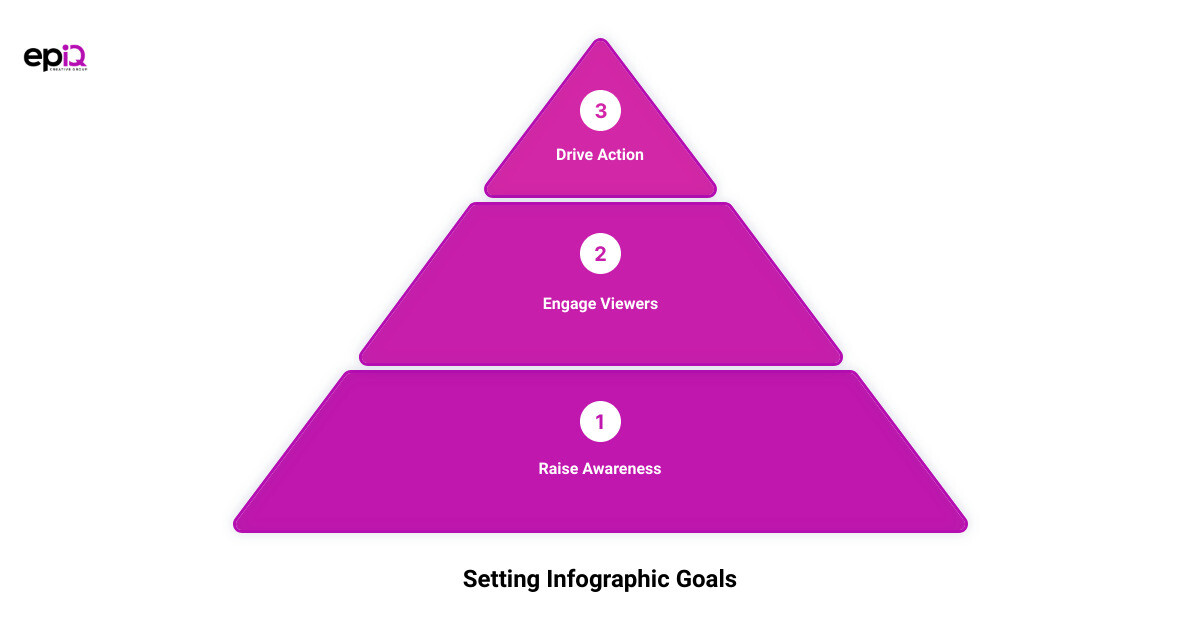
Setting Your Goals
Before you start designing, establish clear goals for your infographic. Are you trying to educate your audience, provide them with useful tips, or persuade them to take a particular action? By setting your goals upfront, you’ll be able to guide the design process and ensure your final product aligns with your objectives.
Gathering Your Information
An infographic is only as good as the information it contains. Once you’ve defined your audience and set your goals, start gathering data and information that supports your objectives. Remember, the information should be accurate, relevant, and sourced from credible and reliable sources.
Choosing the Right Type of Infographic
There are many types of infographics, including statistical, process, comparison, and timeline infographics, among others. Your choice should be based on the nature and quantity of the information you want to present.
Creating a Logical Hierarchy in Your Data
Arrange your data logically to guide your audience through the information. The most important information should be at the top, with supporting data following in a logical sequence. This hierarchy helps your audience understand and retain the information.
Picking and Customizing a Template that Fits Your Message
The look and feel of your infographic should align with your brand and message. Choose a template that supports your data and customize it to match your brand colors, fonts, and style.
Finalizing and Reviewing Your Infographic
Once your infographic is complete, take the time to review it carefully. Check for any errors in the data, ensure the information flows logically, and that the design is visually appealing. Don’t forget to include your logo or website URL for branding and exposure.
By following these steps, you can create an effective infographic that not only looks great but also conveys your message in a way that resonates with your audience. Remember, the key to creating a successful infographic is to keep your audience in mind at every step of the process.
Tips for Creating a Good Infographic
After understanding the steps to create a powerful infographic, it’s time to delve into the nitty-gritty details that can make or break your infographic’s effectiveness. Here are nine practical tips to ensure your infographic stands out and engages your audience.
Writing a Catchy Headline
A compelling headline is your first chance to grab your audience’s attention. It should stir curiosity and give a clear idea of what the infographic is about. The goal is to entice the viewer to engage with the rest of your content.
Leaving Plenty of White Space
Don’t underestimate the power of negative space. A cluttered infographic can be off-putting and difficult to digest. Leaving ample white space makes your infographic visually appealing and easy to navigate.
Creating the Infographic for Your Target Audience
Knowing your audience is fundamental to any marketing strategy. Ensure your infographics are tailored to their needs and interests. Remember, you’re not just creating aesthetically pleasing visuals; you’re creating infographics that resonate with your prospects and engage them.
Keeping Text to a Minimum
Infographics are about visual storytelling. Don’t overload your audience with text. Instead, let the graphics do the talking and use text only to complement the visual data and guide your viewers through the information.
Sticking to a Single Topic
Multiple topics can lead to a cluttered and confusing infographic. Stick to one topic to keep your infographic focused and easy to understand.
Ensuring the Information Flows Like a Good Story
Your infographic should guide the audience through a narrative, from beginning to end. The graphic elements should steer the viewer’s eye through the story in a logical and engaging way.
Citing Your Sources
Just like a term paper, you’re presenting facts and data in your infographic. It’s essential to vouch for that information by citing your sources, usually by listing the relevant URLs below the infographic.
Using a Limited Number of Fonts and Ensuring Legibility
Fonts can make or break the readability of your infographic. Stick to a maximum of two fonts to maintain harmony. Also, ensure that the smallest text is legible, even on smaller screens or when printed.
Including Your Logo and/or Website URL for Branding and Exposure
As a brand, you hope people will share your infographic and give you exposure. Therefore, make sure to include your logo and/or your website URL on the infographic. This turns every share into a branding opportunity and a chance to drive traffic back to your site.
By adhering to these tips, you can design an infographic that not only looks great but also effectively communicates your message and engages your audience. Remember, the power of an infographic lies in its ability to simplify complex information and present it in a visually engaging way.
How to Use Infographics as Powerful Advocacy Tools
You’ve got the design down, you’ve mastered the message, and now it’s time to put your infographic to work. Infographics aren’t just pretty pictures; they are powerful advocacy tools that can drive your brand’s story, enhance your brand awareness, and reach and educate your audience.
Telling the Story of Your Brand or Organization
An infographic can be a visual storyteller for your brand or organization. It can summarize a complex process, display research findings, or explain a new policy in an easy-to-understand manner. It can help you tell a story with data—putting a face to numbers. For instance, an infographic about racial inequality can help your audience understand the gravity of the situation in a visually compelling way.
Remember, good infographics tell stories that people remember and recall over time. They use visuals to support the audience in getting the message, making your brand story more impactful and memorable.
Enhancing Brand Awareness
Infographics can be an effective tool in enhancing your brand awareness. They are visually engaging, easy to share, and can be posted across various platforms, including Facebook, Twitter, LinkedIn, Instagram, and YouTube. This cross-platform sharing allows you to reach different demographics, expanding your brand’s visibility.
Moreover, infographics can be a reflection of your brand’s personality. By incorporating your brand’s color scheme, logo, and unique style into your infographics, you can create a consistent brand image that resonates with your audience.
Reaching and Educating Your Audience
With the plethora of information available online, capturing your audience’s attention can be a daunting task. Infographics, with their visual appeal and simplified data presentation, can be your secret weapon in reaching and educating your audience.
For instance, an infographic summarizing a long blog post or report can make it easy for readers to scan for the most important information. A process infographic can help demystify abstract processes like a customer journey.
Furthermore, infographics can be adapted to different platforms to cater to various audience preferences. For example, a video infographic can be used on YouTube to cater to audiences who prefer video content, while a static infographic can be posted on Instagram or LinkedIn for those who prefer to consume information at their own pace.
In conclusion, infographics are not just about creating visually appealing content. They are powerful advocacy tools that can help you tell your brand’s story, enhance your brand awareness, and reach and educate your audience effectively.
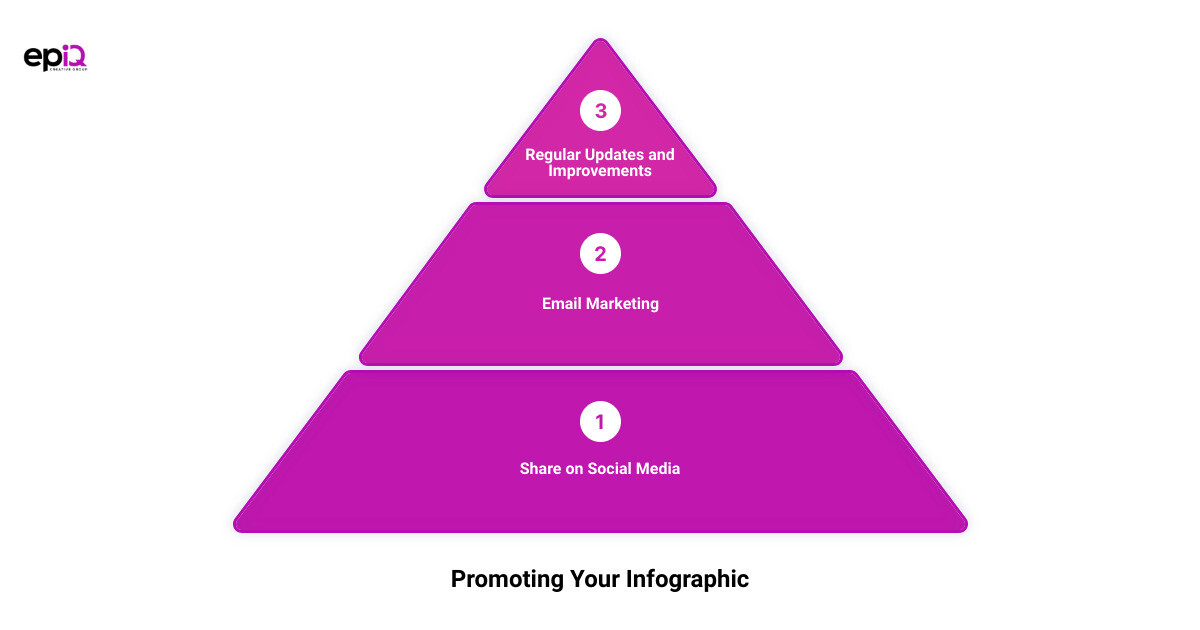
Promoting Your Infographic for Maximum Exposure
The creation of an engaging infographic is only half the battle won. The other half is ensuring its maximum exposure to the right audience. Incorporating the right promotional strategies can amplify the reach of your infographic, boosting your brand’s visibility and impact.
Sharing Your Infographic on Websites and Social Media
Social media platforms like Facebook, Twitter, LinkedIn, Instagram, and YouTube offer a vast audience base and are excellent channels for promoting your infographics. Each platform caters to a different demographic, so it’s crucial to understand where your target audience spends most of their time. For instance, while Facebook is great for engaging with older audiences, Instagram and YouTube are more popular among younger users.
Embed your infographic on your business website or blog post to enhance its visibility. This not only adds value to your content but also improves your SEO, making it easier for people to find your infographic through search engines.
Using Email Marketing to Distribute Your Infographic
Email marketing remains one of the most effective ways to distribute your infographics. It allows you to reach out directly to your audience, providing them with valuable content right in their inbox. Make sure to include a compelling call-to-action in your email, encouraging readers to share your infographic on their social networks.
Getting Feedback and Making Adjustments
Once your infographic is live, it’s essential to monitor its performance and gather feedback. Track social shares, likes, comments, and other engagement metrics to evaluate its impact. Use tools like Google Analytics to understand how your infographic is performing in terms of driving traffic, generating leads, or meeting other marketing goals.
Don’t hesitate to make adjustments based on the feedback you receive. Whether it’s tweaking the design, improving the headline, or updating the data, continuous improvement can help optimize your infographic for better results.
Remember, a well-crafted infographic can significantly boost your brand’s visibility and engagement. However, its success largely depends on a seamless blend of creative design, compelling content, and an effective promotional strategy.
Conclusion: The Impact of Effective Infographics on Your Marketing Strategy
In the digital age, the power to inform, educate, and engage rests heavily on the visual. Infographics, when done right, can become a potent tool in your marketing arsenal. They can seep through the noise of information overload, grabbing attention and making complex data understandable, accessible, and memorable.
The impact of effective infographics on your marketing strategy is multi-faceted. First, they can significantly boost your brand awareness. A creative and impactful infographic can easily captivate viewers, encouraging them to share it on their social networks. This increases your brand’s visibility and helps reach a wider audience.
Secondly, infographics can enhance your brand’s credibility. When you present data in a well-structured, visually appealing format, you demonstrate your expertise and commitment to deliver quality content. This helps build trust with your audience and positions your brand as a thought leader in your industry.
Thirdly, infographics can aid in customer engagement and retention. They can help illustrate your brand’s story, mission, or values in a way that resonates with your audience. Infographics can also be used to explain how to use a product or service, helping customers extract more value from their purchase, thus boosting client retention and loyalty.
Moreover, in the realm of SEO, infographics can be a boon, driving backlinks and boosting your website’s ranking. When your infographic is embedded on other sites, it can increase your search engine visibility and traffic to your site.
Finally, infographics are a versatile medium that can be repurposed across different platforms. Whether it’s social media posts, blog articles, email newsletters, or event promotions, infographics can enhance your content’s effectiveness and reach.
In conclusion, infographics, when strategically integrated into your marketing strategy, can elevate your brand, engage your audience, and drive your business growth. Remember, the key to a successful infographic lies in understanding your audience, crafting a compelling narrative, designing with clarity and creativity, and promoting effectively.
As you embark on your infographic creation journey, remember, it’s not a one-size-fits-all approach. Experiment with different styles, formats, and content types. Keep refining your strategy based on your audience’s response and evolving market trends. The world of infographics is vast and full of potential; it’s up to you to harness its power and use it to your brand’s advantage.